Graphs
Go to the Graphs section in the main menu.
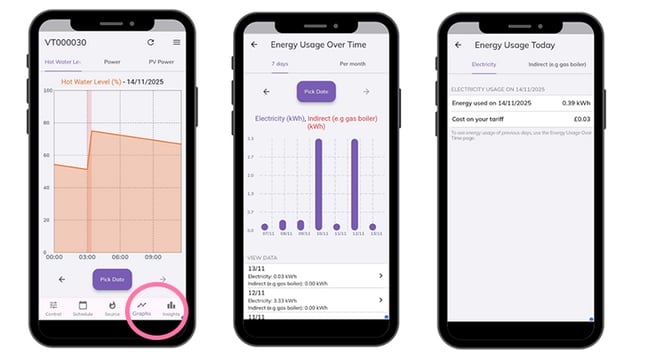
- Hot Water Level %: The volume of hot water in their cylinder as a percentage on any date.
- Power: Power consumption in kW used daily.
- PV Power: PV Power consumption in kW used daily.
Insights
Go to the Insights section of the main menu. This provides usage and cost estimates based on use, household size and energy tariff.
- Electricity: Energy used on the day in kWh and the cost in £ based on tariff.
- Indirect (gas boiler): Energy used on the day in kWh and the cost in £ based on tariff.
- Energy Usage Over Time: Displays either a seven day or month graph of both electricity and indirect (gas boiler) in kWh used.
- Hot Water Usage Over Time: Displays either a seven day or month graph of hot water used in litres.
- Weekly Summary: Requires the the number of people living in the property. The summary shows the total energy use in kWh and efficiency in relation to other Mixergy users.